前言
本文主要介绍在MySql数据库中如何进行基本的死锁分析,尤其是针对线上环境死锁,但是仅仅通过日志可能不是很好分析具体死锁原因的,只能通过死锁日志进行分析。
MySql死锁日志介绍
MySQL的死锁指的是两个事务互相等待的场景,这种循环等待理论上不会有尽头。 比如事务A持有行1的锁,事务B持有行2的锁; 然后事务A试图获取行2的锁,事务B试图获取行1的锁; 这样事务A要等待事务B释放行2的锁,事务B要等待事务A释放行1的锁; 两个事务互相等待,谁也提交不了。
死锁验证
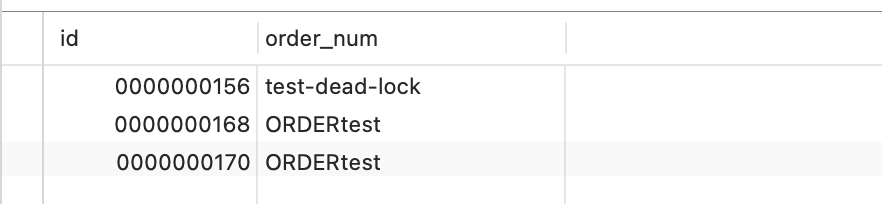
新建表,有如下数据:
start TRANSACTION;
delete from t_order where id = 156;
update t_order set order_num = 'test-dead-lock' where id = 168;
start TRANSACTION;
delete from t_order where id = 168;
update t_order set order_num = 'test-dead-lock' where id = 156;
流程如下:
| 流程 | TRANSACTION1 | TRANSACTION2 |
|---|---|---|
| 1 | begin | begin |
| 2 | delete from t_order where id = 156; | |
| 3 | delete from t_order where id = 168; | |
| 4 | update t_order set order_num = ’test-dead-lock’ where id = 168; | |
| 5 | update t_order set order_num = ’test-dead-lock’ where id = 156; |
死锁日志获取
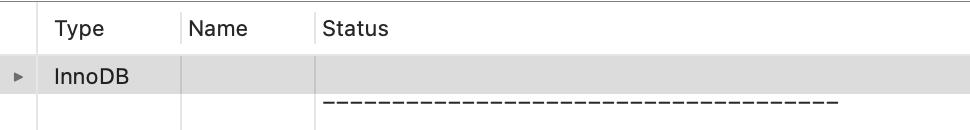
执行show engine innodb status
死锁日志分析
"Type"	"Name"	"Status"
"InnoDB"	""	"
=====================================
2023-01-30 15:57:23 0x16e733000 INNODB MONITOR OUTPUT
=====================================
Per second averages calculated from the last 49 seconds
-----------------
BACKGROUND THREAD
-----------------
srv_master_thread loops: 72 srv_active, 0 srv_shutdown, 252891 srv_idle
srv_master_thread log flush and writes: 252963
----------
SEMAPHORES
----------
OS WAIT ARRAY INFO: reservation count 151
OS WAIT ARRAY INFO: signal count 148
RW-shared spins 0, rounds 198, OS waits 88
RW-excl spins 0, rounds 30, OS waits 0
RW-sx spins 0, rounds 0, OS waits 0
Spin rounds per wait: 198.00 RW-shared, 30.00 RW-excl, 0.00 RW-sx
------------------------
LATEST DETECTED DEADLOCK
------------------------
2023-01-30 15:56:09 0x16e733000 #最近一次发生死锁的日期和时间
*** (1) TRANSACTION: #死锁相关的第一个事务
TRANSACTION 9863, ACTIVE 37 sec starting index read #该事务id为9863,事务处于活跃状态37s,starting index read表示正在使用索引读取数据行
mysql tables in use 1, locked 1 #该事务正在使用1个表,且涉及锁的表有1个
LOCK WAIT 3 lock struct(s), heap size 1136, 2 row lock(s), undo log entries 1 #该事务在等待3把锁,占用内存1136字节,涉及2行记录
MySQL thread id 177, OS thread handle 6152269824, query id 2378 localhost 127.0.0.1 root updating #该事务的线程ID信息,操作系统句柄信息,连接来源、用户
update t_order set order_num = 'test-dead-lock' where id = 168 #该事务执行的最后一条SQL信息
*** (1) WAITING FOR THIS LOCK TO BE GRANTED: #事务1想要获取的锁
RECORD LOCKS space id 24 page no 3 n bits 80 index PRIMARY of table `springboot`.`t_order` trx id 9863 lock_mode X locks rec but not gap waiting
#该事务等待的锁是一个record lock,空间id是24,页编号为3,大概位置在页的80位处,锁发生在表springboot.t_order的PRIMARY索引上,是一个X锁,但是不是gap lock,waiting表示正在等待锁(X:排他锁,S:共享锁),非间隙锁

Record lock, heap no 6 PHYSICAL RECORD: n_fields 4; compact format; info bits 32
 0: len 4; hex 000000a8; asc     ;;
 1: len 6; hex 000000002688; asc     & ;;
 2: len 7; hex 5200000166032b; asc R   f +;;
 3: len 9; hex 4f5244455274657374; asc ORDERtest;;# 表明想要持有值=ORDERtest的那笔数据

*** (2) TRANSACTION:
TRANSACTION 9864, ACTIVE 34 sec starting index read #该事务id为9864,事务处于活跃状态34s,starting index read表示正在使用索引读取数据行
mysql tables in use 1, locked 1 #该事务正在使用1个表,且涉及锁的表有1个
3 lock struct(s), heap size 1136, 2 row lock(s), undo log entries 1 #该事务在等待3把锁,占用内存1136字节,涉及2行记录
MySQL thread id 181, OS thread handle 6148009984, query id 2382 localhost 127.0.0.1 root updating #该事务的线程ID信息,操作系统句柄信息,连接来源、用户
update t_order set order_num = 'test-dead-lock' where id = 156 #该事务执行的最后一条SQL信息
*** (2) HOLDS THE LOCK(S): # 事务2持有的锁 正是事务1想要获取的锁
RECORD LOCKS space id 24 page no 3 n bits 80 index PRIMARY of table `springboot`.`t_order` trx id 9864 lock_mode X locks rec but not gap
Record lock, heap no 6 PHYSICAL RECORD: n_fields 4; compact format; info bits 32
 0: len 4; hex 000000a8; asc     ;;
 1: len 6; hex 000000002688; asc     & ;;
 2: len 7; hex 5200000166032b; asc R   f +;;
 3: len 9; hex 4f5244455274657374; asc ORDERtest;; # 表明持有值=ORDERtest的那笔数据

*** (2) WAITING FOR THIS LOCK TO BE GRANTED: #事务1想要获取的锁
RECORD LOCKS space id 24 page no 3 n bits 80 index PRIMARY of table `springboot`.`t_order` trx id 9864 lock_mode X locks rec but not gap waiting
Record lock, heap no 8 PHYSICAL RECORD: n_fields 4; compact format; info bits 32
 0: len 4; hex 0000009c; asc     ;;
 1: len 6; hex 000000002687; asc     & ;;
 2: len 7; hex 510000016501ec; asc Q   e  ;;
 3: len 14; hex 746573742d646561642d6c6f636b; asc test-dead-lock;; # 表明想要持有值=ORDERtest的那笔数据
#上面这部分是事务二正在等待的锁,从信息上看,等待的是同一个表,同一个索引,同一个page上的record lock X锁,但是heap no位置不同,即不同的行上的锁

*** WE ROLL BACK TRANSACTION (2)
------------
TRANSACTIONS
------------
Trx id counter 9870
Purge done for trx's n:o < 9870 undo n:o < 0 state: running but idle
History list length 4
LIST OF TRANSACTIONS FOR EACH SESSION:
---TRANSACTION 281479704088128, not started
0 lock struct(s), heap size 1136, 0 row lock(s)
---TRANSACTION 281479704089936, not started
0 lock struct(s), heap size 1136, 0 row lock(s)
---TRANSACTION 281479704089032, not started
0 lock struct(s), heap size 1136, 0 row lock(s)
---TRANSACTION 281479704086320, not started
0 lock struct(s), heap size 1136, 0 row lock(s)
---TRANSACTION 9863, ACTIVE 111 sec
3 lock struct(s), heap size 1136, 2 row lock(s), undo log entries 2
MySQL thread id 177, OS thread handle 6152269824, query id 2385 localhost 127.0.0.1 root
--------
FILE I/O
--------
I/O thread 0 state: waiting for i/o request (insert buffer thread)
I/O thread 1 state: waiting for i/o request (log thread)
I/O thread 2 state: waiting for i/o request (read thread)
I/O thread 3 state: waiting for i/o request (read thread)
I/O thread 4 state: waiting for i/o request (read thread)
I/O thread 5 state: waiting for i/o request (read thread)
I/O thread 6 state: waiting for i/o request (write thread)
I/O thread 7 state: waiting for i/o request (write thread)
I/O thread 8 state: waiting for i/o request (write thread)
I/O thread 9 state: waiting for i/o request (write thread)
Pending normal aio reads: [0, 0, 0, 0] , aio writes: [0, 0, 0, 0] ,
 ibuf aio reads:, log i/o's:, sync i/o's:
Pending flushes (fsync) log: 0; buffer pool: 0
509 OS file reads, 891 OS file writes, 507 OS fsyncs
0.00 reads/s, 0 avg bytes/read, 0.00 writes/s, 0.00 fsyncs/s
-------------------------------------
INSERT BUFFER AND ADAPTIVE HASH INDEX
-------------------------------------
Ibuf: size 1, free list len 0, seg size 2, 0 merges
merged operations:
 insert 0, delete mark 0, delete 0
discarded operations:
 insert 0, delete mark 0, delete 0
Hash table size 34679, node heap has 0 buffer(s)
Hash table size 34679, node heap has 0 buffer(s)
Hash table size 34679, node heap has 0 buffer(s)
Hash table size 34679, node heap has 0 buffer(s)
Hash table size 34679, node heap has 1 buffer(s)
Hash table size 34679, node heap has 0 buffer(s)
Hash table size 34679, node heap has 0 buffer(s)
Hash table size 34679, node heap has 0 buffer(s)
0.00 hash searches/s, 0.00 non-hash searches/s
---
LOG
---
Log sequence number 3001164
Log flushed up to   3001164
Pages flushed up to 3001164
Last checkpoint at  3001155
0 pending log flushes, 0 pending chkp writes
314 log i/o's done, 0.00 log i/o's/second
----------------------
BUFFER POOL AND MEMORY
----------------------
Total large memory allocated 137428992
Dictionary memory allocated 148351
Buffer pool size   8192
Free buffers       7765
Database pages     426
Old database pages 0
Modified db pages  0
Pending reads      0
Pending writes: LRU 0, flush list 0, single page 0
Pages made young 0, not young 0
0.00 youngs/s, 0.00 non-youngs/s
Pages read 367, created 59, written 515
0.00 reads/s, 0.00 creates/s, 0.00 writes/s
No buffer pool page gets since the last printout
Pages read ahead 0.00/s, evicted without access 0.00/s, Random read ahead 0.00/s
LRU len: 426, unzip_LRU len: 0
I/O sum[0]:cur[0], unzip sum[0]:cur[0]
--------------
ROW OPERATIONS
--------------
0 queries inside InnoDB, 0 queries in queue
0 read views open inside InnoDB
Process ID=1616, Main thread ID=6142193664, state: sleeping
Number of rows inserted 939, updated 2, deleted 16, read 1596
0.00 inserts/s, 0.00 updates/s, 0.00 deletes/s, 0.00 reads/s
----------------------------
END OF INNODB MONITOR OUTPUT
============================
"
总结
通过本文[[MySQL死锁日志查看与分析#死锁日志分析]]中一些枯燥的注释,基本可以看出事务9863和事务9864存在冲突,导致数据库层面发生死锁,正常线上代码应该尽量规避死锁,由于线上情况比较复杂,这里给出几个可供参考的解决方案:
- 针对一些update强制调整成按照主键顺序执行,如果是根据非唯一组合所以进行更新,则考虑使用分布式锁,针对进行进行大批量锁定
- RC隔离级别MySql,代码层面规避使用delete-insert-update对同一数据进行多次db操作,因为并发情况下会导致出现乐观锁报错或者其他业务报错,从而带出范围锁,进一步引发出死锁